
The uranium squeeze: utility coverage, demand and changing dynamics
Coverage ratios point to a fifteen-year low in forward contracting even as inventories hit records, and the resulting pricing power is already showing up in producer language and term prices.


Utilities have nowhere left to hide
A coverage ratio measures how much of the uranium a utility will need to load into its reactors in a given year it has already contracted to buy. 60% coverage for 2030 means six pounds in ten are locked in at an agreed price and delivery date, and four pounds in ten still have to be found, at whatever the market is charging when the utility finally goes looking. An inventory figure answers a different question entirely: how much uranium is physically sitting in a utility’s stores right now, most of it already earmarked for reactor reloads in the next year or two.
The two numbers can move in opposite directions without contradicting each other. A utility can be running down its coverage of 2032 while its warehouse fills up with material delivered against contracts signed back in 2019, because that material was always going to arrive on schedule regardless of what gets signed today. EU and US utility inventories both hit records in 2025 and 2024 respectively, at 110.6 million pounds of U3O8 equivalent (42,522 tonnes of uranium equivalent) and 126.4 million pounds. EU inventories cover roughly 3.6 reload-years. US inventories cover about 2.5 years.
Both figures describe stock already committed to near-term reloads not the years beyond 2030, which is what the coverage-ratio data helps us measure.
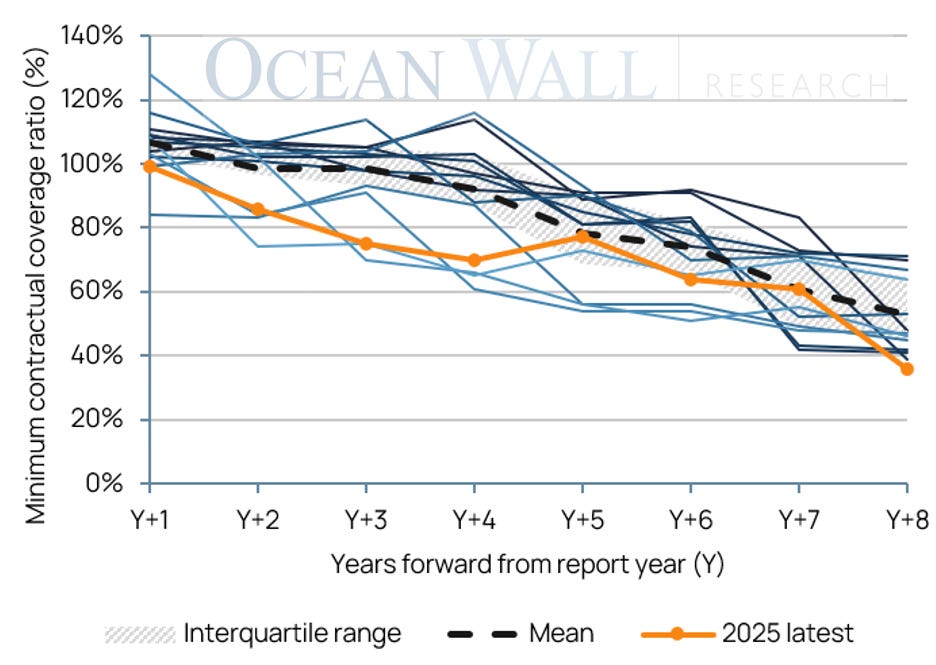
We index the coverage ratio from every EU Annual Report since 2011 by distance from the report date, rather than by calendar year. A consistent pattern of utility contracting behaviour emerges: coverage is close to full one year out and declines the further ahead the horizon extends, as contracted volume thins with distance from the report.
Figure 1: EU utility forward coverage, normalised by report-year vintage (2011-2025)
Source: Euratom Supply Agency, WNA, Ocean Wall Research
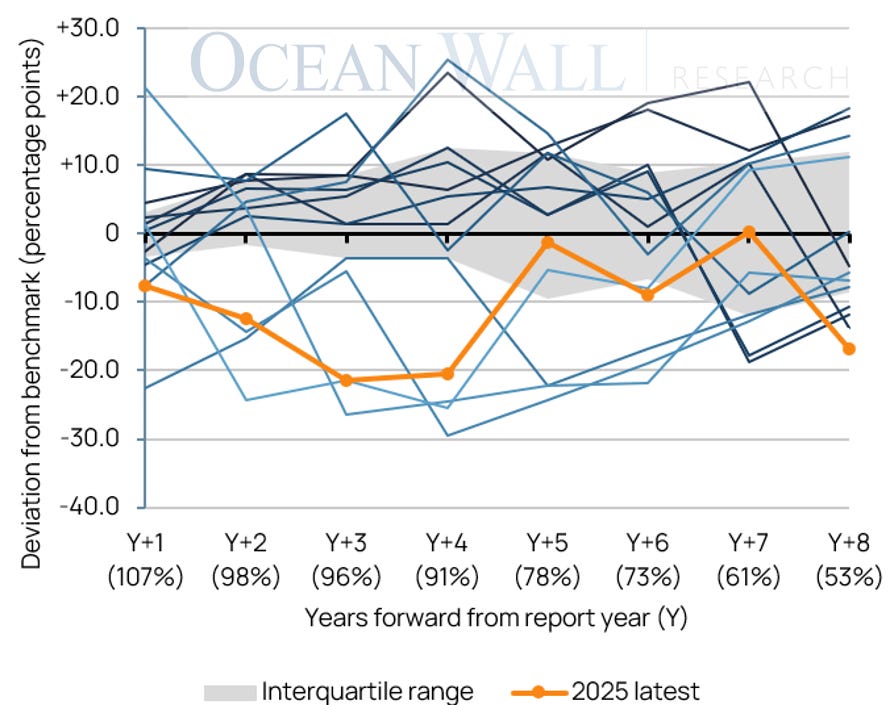
Figure 2: EU forward coverage, deviation from a fixed benchmark (2011-2025)
Source: Euratom Supply Agency, WNA, Ocean Wall Research
The 2025 Euratom Supply Agency Report follows that shape. One can immediately see the effects of EU utility stockpiling, catalysed by the Russian ban, in both charts: contracting deviates below the historical average in years one to four..
Eight years out, the 2025 vintage shows 36% of requirements contracted, against a historical average across comparable report years of 53%, a shortfall of roughly 17 percentage points and the weakest reading in the series at that distance. Notably, that deviation is a fifteen-year low in how far forward EU utilities have committed.
The story in the US isn’t dissimilar.